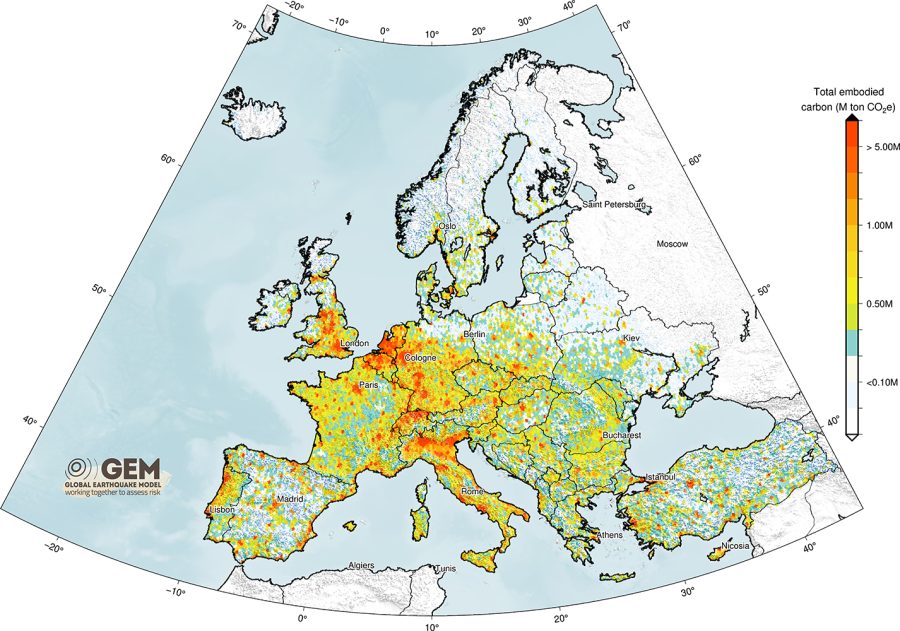
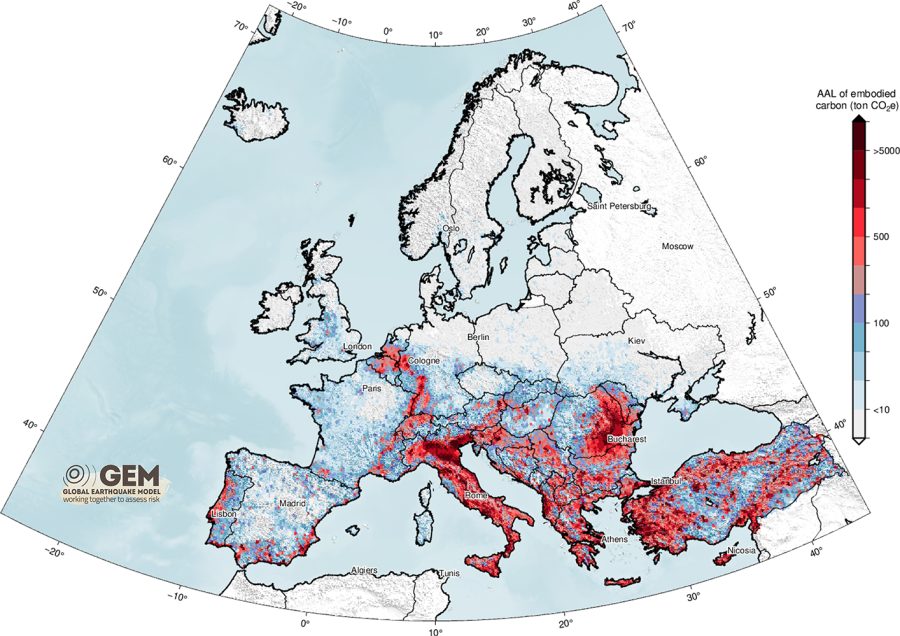
Embodied Carbon is a service (available in this GitHub repository) maintained and developed by the Global Earthquake Model (GEM) Foundation that provides access to data and maps of the embodied carbon associated with the seismic damage repair and replacement of residential, commercial and industrial buildings worldwide. This service can be used in various studies on the built environment, such as: i) to provide benchmark data on the embodied carbon of different building typologies; ii) to assess the environmental impact of natural hazards on the built environment; and iii) to assess the impact of different forecasts of urbanization on the global carbon budget.
To develop a database of Replacement Embodied Carbon for various building typologies we have identified the primary building typologies in terms of lateral load resisting system and main construction material (classified with the GEM Building Taxonomy v3.1) with which we construct buildings today in Europe. For each building typology we have cataloged the main structural members and non-structural components, their construction materials and their quantities (per square metre of built area).
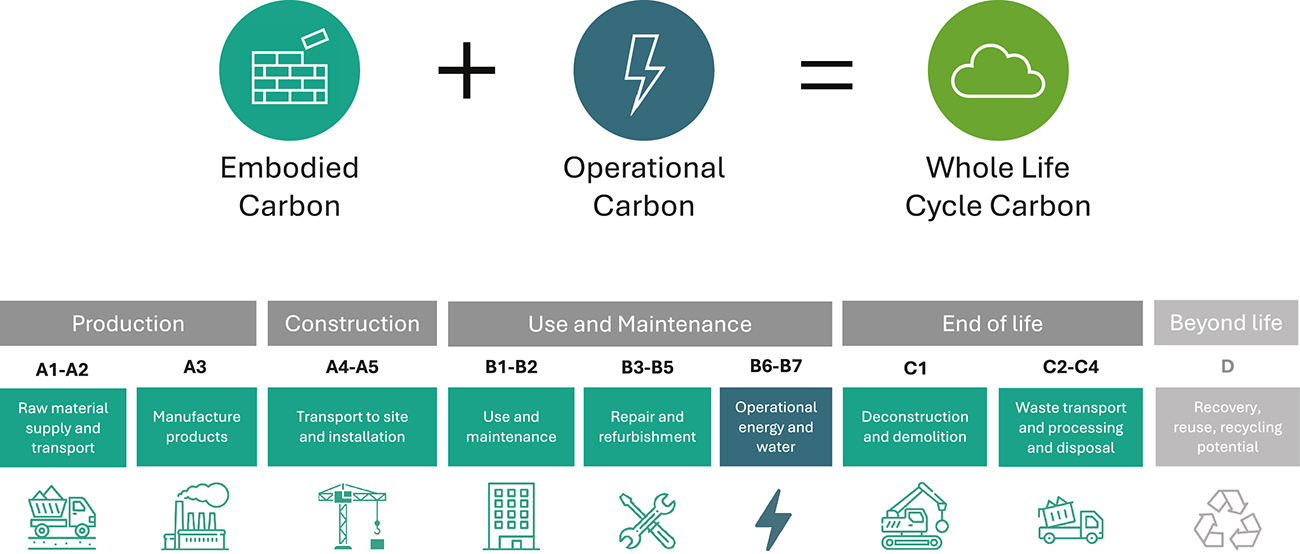
The replacement embodied carbon encompasses emissions from various life-cycle stages, including material production (modules A1-A3) and construction (modules A4-A5) of a new structure, as well as end-of-life processes (modules C1-C4) of existing damaged buildings. These modules are defined based on the European standard EN 15978. Embodied carbon factors for each component have been collected from a number of online, open resources (e.g. Environmental Product Declarations from databases of different European countries). For each building typology we have combined the quantity of components with their respective carbon factors in order to obtain the replacement embodied carbon per square metre of built area. Relevant data is accessible through a dedicated GitHub repository.


